Category Archives: Weather reports

About the weather in a particular race.

Ocean racing along the latitude parallels

This is not really a report on my Geraldton-Cape Town race so much as some observations on SOL ocean racing which hopefully might lead to some conversations on the Solfans blog and Sol chat.

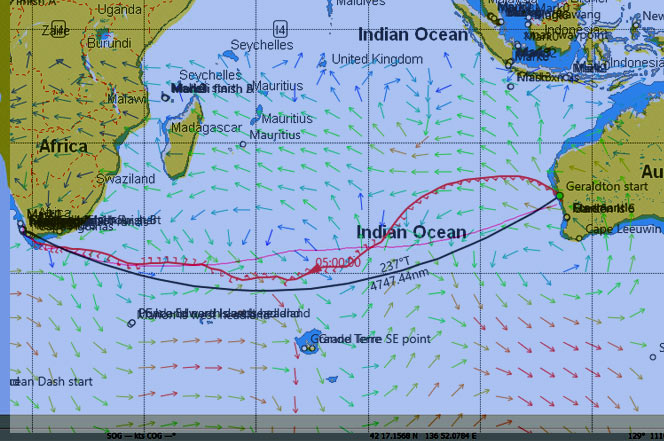
I have promised to do a Pilot Charts routing before each race to show what, according to the ‘most likely’ reading of the Pilot Charts for the location and time and year we are racing, would be the ‘most likely’ quickest course.

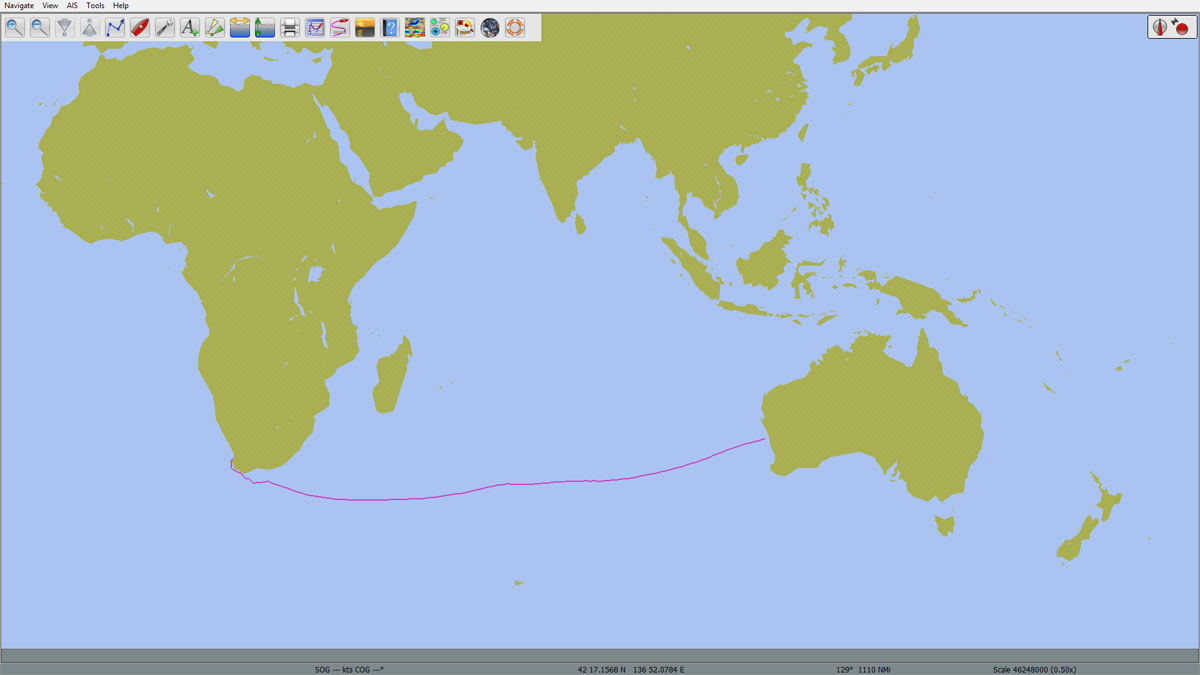
This is of course not likely to be the course any of us might actually sail because we’ll be racing in ‘real weather’, and not ‘most likely’.  However, even from this second race where I have compared the Pilot Charts course with the actual, there are some interesting observations to make. Continue reading Ocean racing along the latitude parallels

Routing Based On Pilot Charts – Geraldton to Cape Town preview

It seemed to me that as a part of course pre-planning for long ocean races, it might be useful if I published on Solfans for each new SOL ocean race the suggested OpenCPN routing based on Pilot Chart wind data for people to make use of if they so desired.  It also seemed that it might be a useful resource for the non-routers out there.

Here is that route for the upcoming Geraldton Cape Town race.

Geraldton-Capetown-pilot-charts-route-March

I have run a route on my own router using the SOL grib data and superimposed that for comparative purposes.  The suggested Pilot Chart routing for March is the pale pink line and the routing using SOL and NOAA extended grib data as at the 22:30 WX on Feb 28 is the deeper pink line with the wind direction barbs attached.  You can see that the primary difference is that the current weather data suggests a much more northerly route than the Pilot Charts suggest, principally because of a significant high currently lying west of Perth.

The OpenCPN Pilot Chart route suggests a trip of 18 days 8 hours, and the route using SOL weather suggests 14 days 13 hours.  In other words, we can expect a faster than average trip.Overlay-Geraldton-Cape-Town

Continue reading Routing Based On Pilot Charts – Geraldton to Cape Town preview

SSANZ 100 — pre race

At start time, a Low Pressure system is moving east across North Island − crossing the coast at Hokianga Harbour, about 100nm NW of Auckland.
SSANZ100StartWeather00Zpct67This weather system will determine the winds (TWS and TWD) for the fleet throughout the race.

An initial wind forecast of 6 kts out of the east dictates an on-the-wind start.  The sail remains a beat to wind’ard until past the initial Motutapu S mark and into the Motuihe Channel.

Continue reading SSANZ 100 — pre race

RTW6 — pre-race

RTW6 Rhumb and GC routes
Chart #1 — Rhumb Line and Great Circle Route comparison.

In this race, there are three reasons to head up the east coast of the United States and Canada.

First,  the Great Circle Route goes that way. Despite appearances, the Rhumb Line on Chart #1 is about 165 nm longer than the Great Circle Route arcing to the north side of the rhumb.

But second, and more important, is the Bermuda High.

Continue reading RTW6 — pre-race